The market creates a set of criteria (levels prior to an event) and then distinctly moves in a manner that says: «Right, I’m about ready to take serious direction in the following way”. This is the big unspoken key aspect that is unique to the Hunt Volatility Funnel theory.
The HVF concept “key levels of significance (KLOS)” goes beyond just support and resistance, the traditionally wellknown element of horizontal levels in technical analysis.
Key points:
– Why to trade the “breakout way”?
The clearest result of a good breakout strategy is to gain a substantial return very fast; In other words, big moves in your favour in a short period of time, and the benefit of this is that you’re in the market only for that period.
Here comes the law of market geometry: “For every action there’s an equal and opposite reaction”.
Remember that the same participants are usually in the market every day, and the big players determine the market size using the same amount of leverage; When they go oversold and they overbuy, that’s usually the scale to which they will overreact to the opposite direction (they have to get out of those same leveraged position).
i.e:
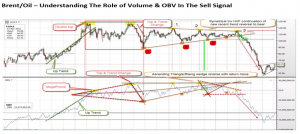
– Volume
It can precede, in many instances, key moves.
We should start to use one of the genuine value indicators in volume, which is a set of data and not price crunched in a mass formula (the On Balance Volume indicator).
i.e:
– Getting the news before the news
Often, the breakout is supported by fundamental news.
Obviously you don’t know that news, so you get to trade it and find it out later (kind of getting to move with the insiders and the “big money”).
Quite often, by the time it’s well exposed and documented (the news), the main part of the move has already occurred and that’s usually when the smart money is taking some of its profits (invariably it uses the power of patterns).
There is always a natural geometry that is created by charts; In other words, there must become imbalance in the supply and demand, whether it is for a newsbased reason or for some reason as yet undisclosed to you, but if it’s deemed that the previous price behaviour is in relevance to a level and it is overcome, then there is a great opportunity for a trade.
That’s what we will do in our macro timeframe and then ensure that our base setup is tying that in. We want that trigger entry level (needs to be a pending order) as we are waiting for the key event, for the market to tell us when we should be trading (we let the market take us in).
i.e:
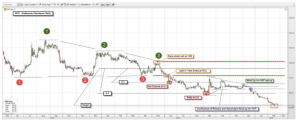
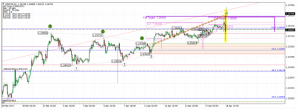
Inverted HVF on Gulf Sands Petroleum> We called this way back in 2013 prior to the oil collapse and the war in Syria, and it was the epitome of news before the news (and contrary to a number of newsletter circulars recommending it as a buy):
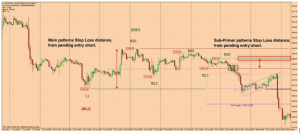
– Tight, but not so tight that it suffocates you
Tight stop-losses kill good trades.
The key value of this is the financial mathematics of trading and the risk-reward ratio; The tighter the stop loss with the same reward the better the risk-reward ratio, but if we got tighter, we shouldn’t trade bigger size.
i.e:
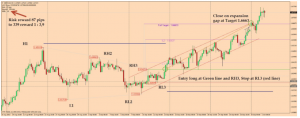
– Positive slippage
Due to I’m buying what everyone else is selling, and if it gaps, I get out even higher than I plan.
People who are selling what everyone else is selling, they get negative fulfillment slippage, and we will benefit from their herd response, by being on the other side.
i.e:
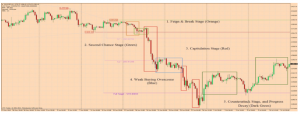
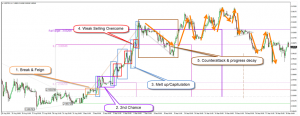
HVF stages:
– Stage 1: The feign & break
Here we drip (the first run).
It always tests the level (sensitive one), breaks through it almost like an electric fence and has a little pop-up above it.
– Stage 2: The second chance
Here you could grab new shorts/longs if you miss the trade at the beginning.
– Stage 3: The capitulation
This is where the market runs (big move) and you just start making profit.
Total imbalance in supply and demand with no bias to be found.
– Stage 4: Weak buying overcome
Some buyers saying: «Surely, it’s going too far…let’s get in», but is still a capitulation on, and the target has to be made.
Key at this interim level and how this ties in.
– Stage 5: Counterattack & progress decay
Now you’re out on the strength and one of the strong buy/sell of bars are back into a buying/selling frenzy.
Here the trade is closed and the likelihood is you weren’t even watching it (take-profit pending order)
Two 5 stages examples:
Apasionado de las finanzas en cuyo haber profesional incluye haber trabajado en el front-office de firmas de trading propietario, asi como para los principales bancos del país. Y aun con su juventud cuenta con dos carreras universitarias y tres postgrados en finanzas, todo ello en las mas prestigiosas instituciones de Madrid, Londres, y Filadelfia.

Deja una respuesta